UPPER DELAWARE REGION — We’ve all seen the change in temperatures on a worldwide scale. But thanks to the Eastern Rivers and Mountains Inventory & Monitoring Network—part of the …
Stay informed about your community and support local independent journalism.
Subscribe to The River Reporter today. click here
This item is available in full to subscribers.
Please log in to continue |
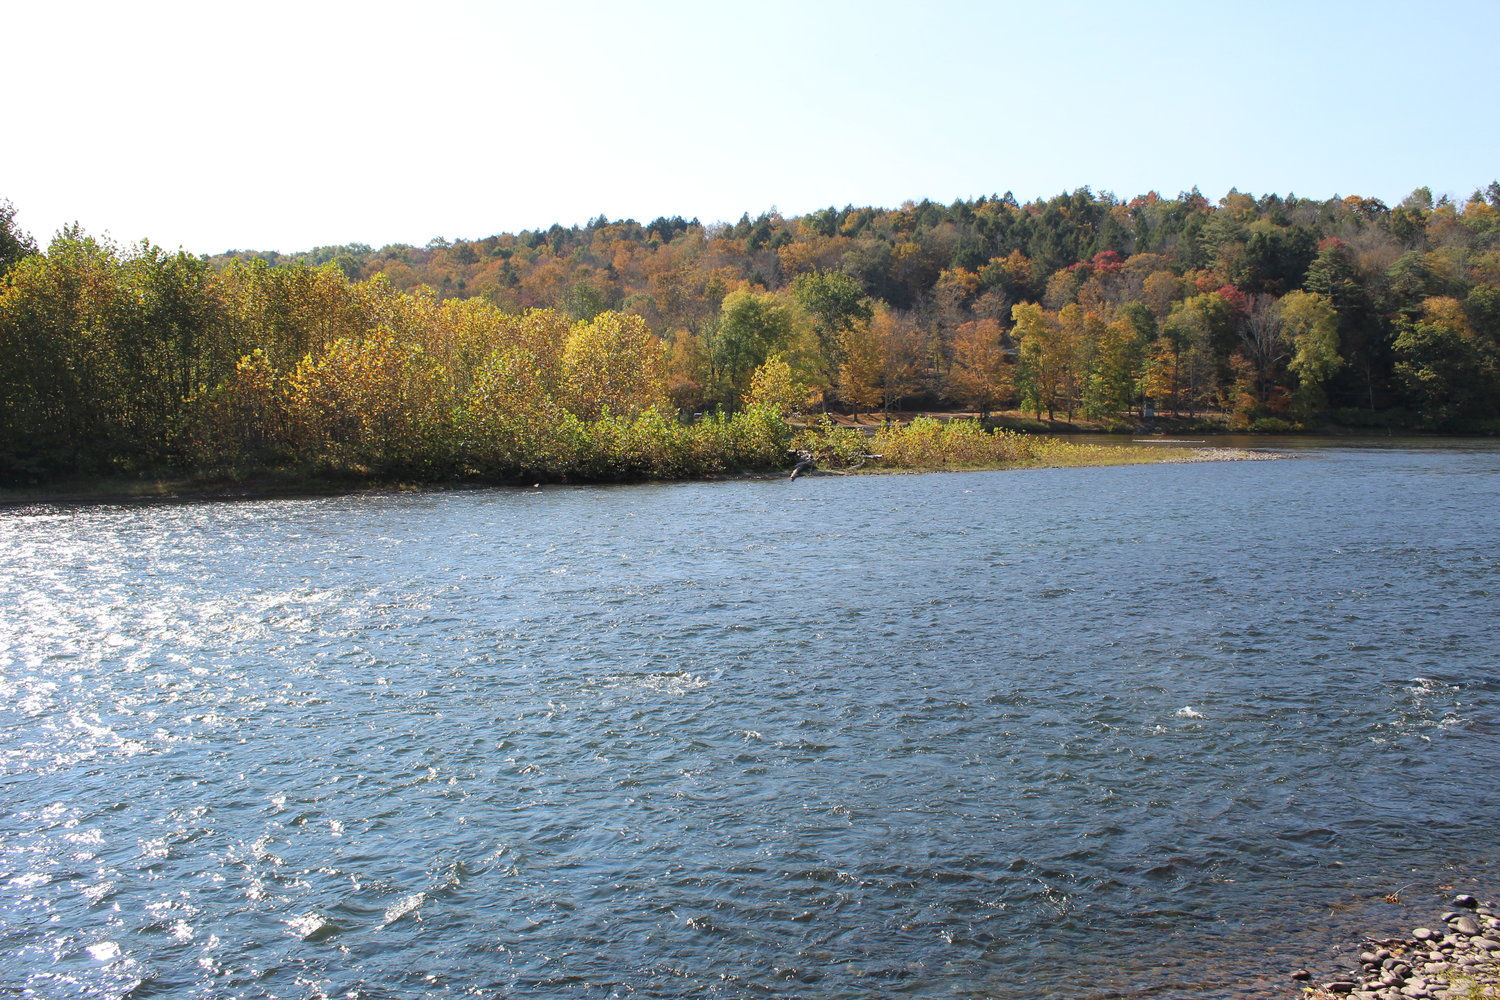
UPPER DELAWARE REGION — We’ve all seen the change in temperatures on a worldwide scale. But thanks to the Eastern Rivers and Mountains Inventory & Monitoring Network—part of the National Park Service—which used data from the National Oceanic and Atmospheric Administration (NOAA), we can see it for the Upper Delaware region too.
Eastern Rivers and Mountains collects information from Pike and Wayne counties in Pennsylvania and Delaware, Orange and Sullivan counties in New York. That work gives a snapshot of the state of everything from air and water quality to animals to weather and climate data.
The last two are the focus here.
Start with the weather. A National Park Service (NPS) report, “2021 Weather In Review: Upper Delaware Scenic and Recreational River,” lays out the difference between weather and climate.
Weather is what you see when you look out the window, the way the atmosphere changes. And we’re only talking short-term—as short as minutes; as long as months.
“Climate is what you expect to see based on long-term patterns of over 30 years or more,” according to the report. We expect to see some snow by mid-December and July and August are supposed to be hot.
The NOAA data goes back 126 years, to 1895. You can track change over time.
Globally, the average land and ocean surface temperature of the 21 years in 2021 was 1.51 degrees Fahrenheit above the 20th century average of 57 degrees Fahrenheit (which worked from a century of data.)
The 2021 record was the sixth highest global land and ocean temperature for a calendar year in the 1880–2021 record, according to NOAA.
Of course, the temperatures changed here too.
Last year was “very warm and wet,” the network found. It was the fifth-warmest and 23rd-wettest year on record in the park.
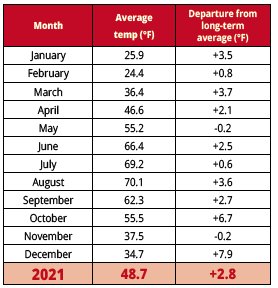
“All seasons were warmer than normal,” and 10 months had higher-than-normal temperatures, Eastern Rivers and Mountains noted, and January, March, August, October, and December were all more than 3.5 degrees Fahrenheit above long-term averages. See Table 1.
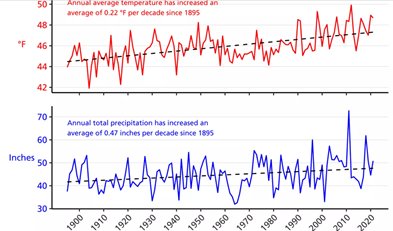
Factoring in decades of data, the average annual temperature here has increased 0.22 degrees Fahrenheit.
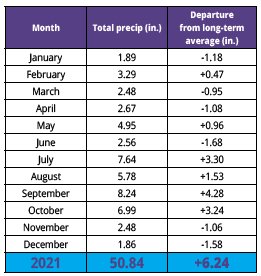
Meanwhile, last summer was also wet. “Total precipitation was above normal for the year,” according to the network. “The year ended as the 23rd wettest on record for the counties surrounding the park. In total, 50.84 inches of precipitation fell, more than six inches above the long-term average.” Total rainfall has increased 0.47 inches per decade. See Table 2.
The Eastern Rivers and Mountains report, using data taken from counties surrounding the park, shows that “annual average temperature has increased approximately 0.22 degrees Fahrenheit per decade. Annual total precipitation has increased about 0.47 inches per decade.” (See graph on page 10.)
And the future is troubling. Models from Eastern Rivers and Mountains estimate that by 2100, “annual average temperature at the park will increase by 3.2 degrees Fahrenheit (in a best-case scenario) to 9.5 degrees Fahrenheit (in the worst case).”
Annual total precipitation is expected to increase by seven to 14 percent. (To read the “2021 Weather in Review” report, go to https://bit.ly/3M7HxNi.)
So: more heat, more water coming down. Possibly more flooding. Extreme weather could loom.
“Scientific reports like these offer indisputable statistics,” said Upper Delaware Council executive director Laurie Ramie, “to support the common knowledge that our climate is changing with increasingly more extreme weather events.”
In their report “Disproportionate magnitude of climate change in United States national parks,” Gonzalez et al. projected greater temperature and precipitation change in national parks overall and broke the data down for each one. Alaska has seen the greatest amount of warming.
Continued climate change, studies have found, “increases future vulnerabilities of ecosystems to plant and animal extinctions, range losses, invasive species and other disruptions.”
Read “Disproportionate magnitude of climate change” at https://bit.ly/3uFgR0v.
Other reports, such as the one detailed in the story above, are courtesy of publicly available data and analysis from NOAA’s National Climatic Data Center. The information dates back to 1895, allowing the Park Service to provide a summary of what happened in the past year, with context provided by the 126-year time series.
Learn more about NOAA’s data and its Climate at a Glance program at https://www.ncdc.noaa.gov/cag/.
And the Eastern Rivers and Mountains Inventory & Monitoring Network can be found at https://www.nps.gov/im/ermn/index.htm.


Comments
No comments on this item Please log in to comment by clicking here